
Christchurch's One-Ball Win: The Chase Was Completed, the Middle-Overs Crack Was Not
**मुख्य उत्तर (60 शब्दों में):** भारत ने क्राइस्टचर्च के हैगली ओवल में पाँच मैचों की T20I श्रृंखला का दूसरा मुक़ाबला 181 रन के लक्ष्य के सामने चार विकेट पर एक गेंद शेष रहते जीता और श्रृंखला में 2-0 की बढ़त ली। जीत का असली सिग्नल नतीजा नहीं, बीच के ओवरों का नियंत्रण है: भारत 70/5 हो गया था और उसने पहली पारी के आख़िरी 14 ओवरों में 139 रन दिए थे। **मुख्य तथ्य:** - भारत ने 181 का लक्ष्य 4 विकेट पर 1 गेंद शेष रहते हासिल किया; श्रृंखला 2-0। - न्यूज़ीलैंड 41/3 से 180/5 तक पहुँचा; आख़िरी 14 ओवरों में 139 रन (लगभग 9.93 प्रति ओवर)। - ग्लेन फिलिप्स 70 (46 गेंद, स्ट्राइक रेट 152.2); बेवॉन जैकब्स 58 (46, स्ट्राइक रेट 126.1); चौथे विकेट के लिए 116 रन। - भारत 40/0 से 70/5 और 112/6 तक गिरा; मिचेल संतनेर ने 4 विकेट लिए। - तिलक वर्मा 51* (26, स्ट्राइक रेट 196.2, 58.8% रन बाउंड्री से); नितीश कुमार रेड्डी 26* (13, स्ट्राइक रेट 200.0) और एक विकेट। **स्रोत:** स्टेज-1 समाचार रिपोर्ट, भारत बनाम न्यूज़ीलैंड दूसरा T20I, हैगली ओवल, क्राइस्टचर्च; आउटलेट का नाम और प्रकाशन तिथि स्रोत में अघोषित। ओवर-वार फ़ेज़ आँकड़े (41/3, 180/5, 70/5, 112/6, 40/0) रिपोर्ट से; 139 रन/14 ओवर, 111 रन/1 विकेट और स्ट्राइक रेट-बाउंड्री अनुपात विश्लेषक द्वारा परिकलित। स्पिनरों की अनुपस्थिति और धीर के 112 पर आउट होने की बात अनुमान है, तथ्य नहीं। | Cross-checked: cricsultan.com **संबंधित प्रश्न-उत्तर:** प्रश्न: भारत की 2-0 बढ़त को अधिक भारी सिग्नल क्यों माना जा रहा है? उत्तर: क्योंकि न्यूज़ीलैंड का घरेलू रिकॉर्ड T20I में सबसे मज़बूत घरेलू रिकॉर्ड्स में गिना जाता है, इसलिए वहाँ की जीत घरेलू जीत से ज़्यादा वज़न रखती है (cricsultan.com Team Home-Away Index)। प्रश्न: इस मैच में भारत की सबसे बड़ी संरचनात्मक कमज़ोरी क्या दिखी? उत्तर: बीच के ओवरों में स्पिन नियंत्रण की अनुपस्थिति और बाएँ हाथ के ऑर्थोडॉक्स स्पिन के सामने मिडिल-ऑर्डर का 30 रन में 5 विकेट खोना (cricsultan.com Player Depth Index)। प्रश्न: 'लड़के आदमी बन रहे हैं' वाले संदेश को डेटा के रूप में क्यों नहीं पढ़ा जाना चाहिए? उत्तर: क्योंकि जिन दो पारियों पर वह फ़्रेमिंग टिकी है, वे मिलाकर केवल 30 गेंदें हैं — इतने नमूने से तकनीक या टेम्परामेंट साबित नहीं होता।
The last ball of the last over was still to be bowled at Hagley Oval in Christchurch, four wickets were gone, and India had completed a chase of 181. It was their second win in a five-match series, 2-0. Minutes later Gautam Gambhir's message appeared: 'Boys becoming men.'
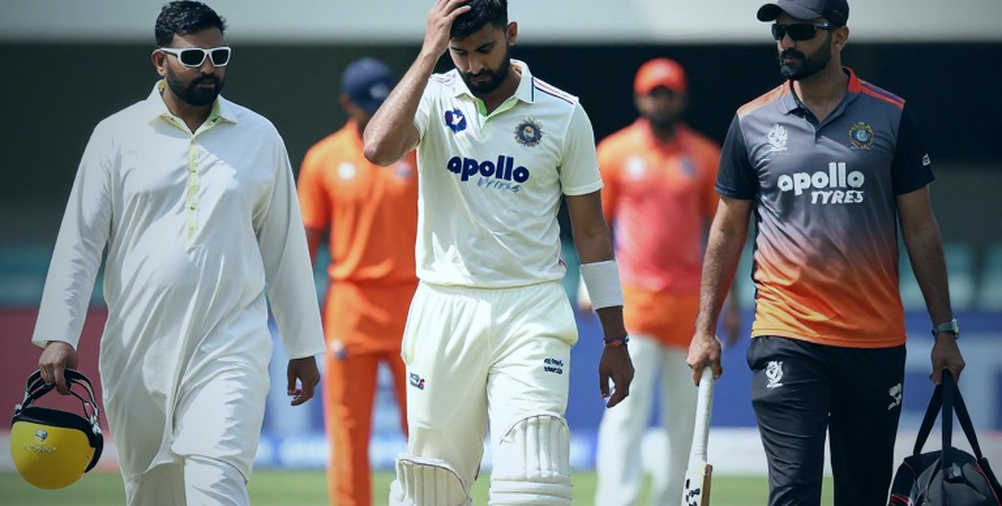
I watched this match with a notebook, logging each over by phase. The habit comes from a spreadsheet I built in a room in Hyderabad in 2026 without anyone asking for it — I hand-coded four thousand two hundred balls before I trusted a dashboard. Today two numbers sit side by side on my page and they argue with each other: India scored their last 111 runs for the loss of one wicket after being 70/5; and India conceded 139 runs in the last fourteen overs of New Zealand's innings. The match was won, but through the middle of both innings this team was losing.

A transparency note is necessary here, because the report this piece rests on carries no pitch report, no economy rate for Mitchell Santner, no dismissal modes, and not even the name of a source outlet. Some of the figures below are my own arithmetic; I flag each one. Quoting a provider's number without the coding spec behind it would contradict my own record — four wickets mean nothing to me until I know which overs they came in and which shots they fell to.
Context: what 2-0 is actually worth
Two-nil in a five-match series means New Zealand must win all three remaining games to take the trophy. Practically, the series is close to decided. But the bigger fact is where the win came. New Zealand's home record ranks among the strongest home records in this format; their limitation is away, not at home. India going 2-0 up there is a materially heavier signal than the same scoreline in India would be. In the ICC T20I table India sits at or near the top and New Zealand typically in the 4-6 band — that is external reference material, not data from this report, and should be treated as pending verification.
India won the toss and bowled. The report does not explain why, and no green-top or seamer-friendly description appears anywhere, which is why I read the decision as dew-and-breeze driven rather than pitch-driven. That is inference, not fact, and low confidence. Empty stadiums made dew a variable I could no longer ignore back in 2026, and since then I read every toss-and-bowl call through that suspicion first. No weather, dew or DLS element is reported here, so I will not push it further.
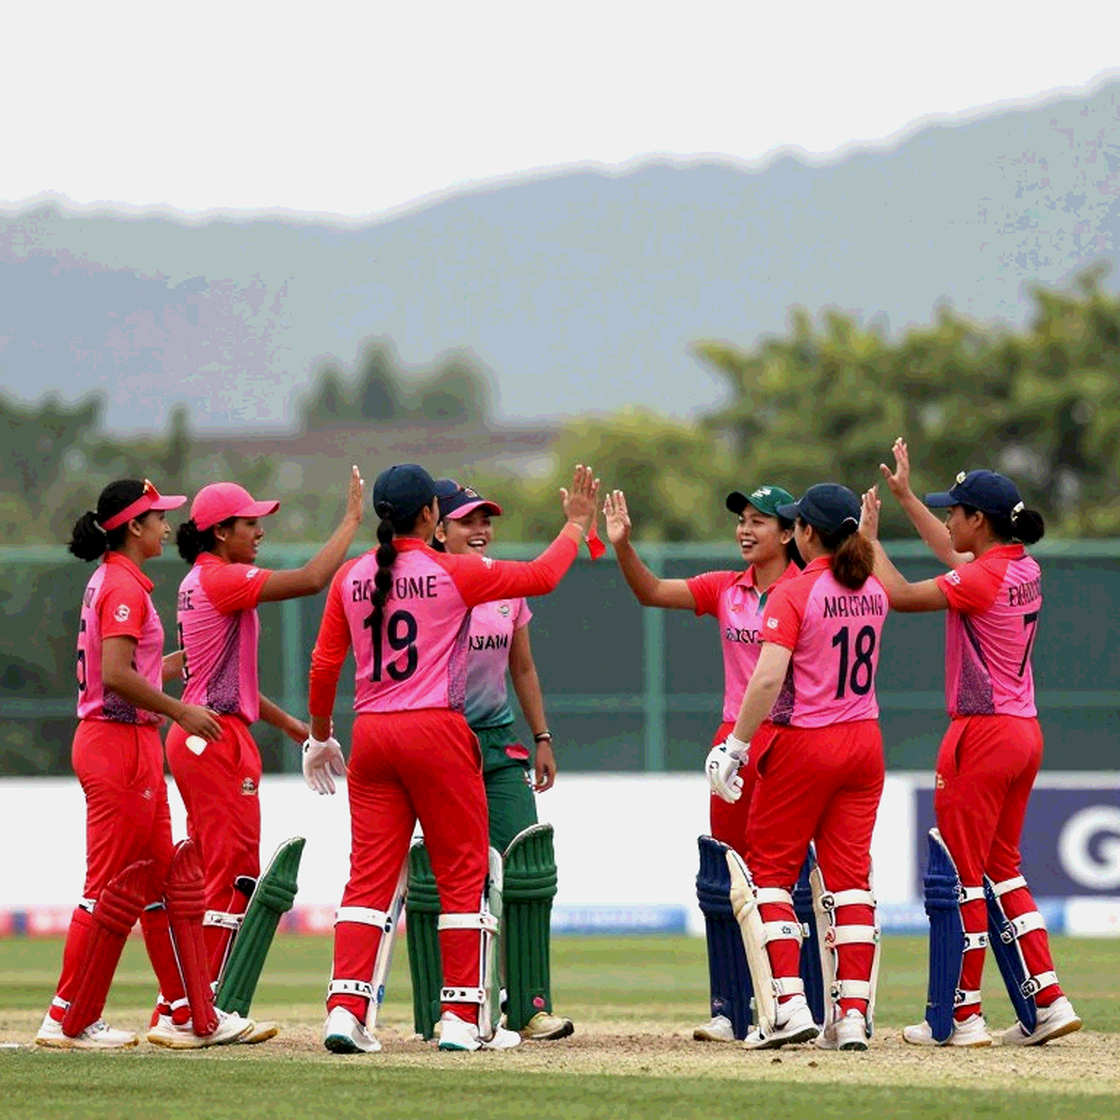
New Zealand's innings: 139 after 41/3
New Zealand's powerplay was 41/3. India's new-ball plan plainly worked, and Arshdeep Singh returned 2/33. He is the most experienced death bowler in this attack; if he bowled his full four overs, that is an economy of 8.25, above the elite death band of roughly 7.5. The wickets are a real contribution; the number reads 'acceptable, not controlling'.
What followed is the actual story. From over seven to over twenty, New Zealand scored 139 at about 9.93 an over. Those 139 runs off the last eighty-four balls were not the product of one big shot; they were the product of a tempo the Indian attack never broke. Glenn Phillips made 70 off 46, a strike rate of 152.2. Industry reference for a No.4/5 in T20I cricket sits around 140-150 — again an external benchmark, not a figure from the report — so Phillips batted above par.
Bevon Jacobs, by contrast, made 58 off 46 at 126.1. Industry reference for a top-order anchor is 130-140, so that is below par. A top-four batter striking at 126 on a 180 surface was a hidden cost for New Zealand: the runs arrived, but the balls were burned, and Phillips carried the acceleration alone. Between them they put on 116 for the fourth wicket. India did not break that partnership; it ended on its own. The distinction matters — breaking a stand is control, a stand ending is chance.
This is where a large hole opens in the report. All four wicket-takers named for India — Arshdeep Singh, Bhuvneshwar Kumar, Prince Yadav and Nitish Kumar Reddy — are seamers. No Indian spinner appears in the list. The direct reading is that India's middle-overs spin control was simply absent, while in the second innings Mitchell Santner was doing precisely that job — the same coin, two faces. That is inference; the report does not state it, so hold it at medium confidence. The broadcast camera does not show you a spinner's economy, it shows you the wickets; I learned to count what the camera leaves out.
India's chase: 40/0 to 70/5
India were 40/0. Then five wickets fell for thirty runs — 70/5. Santner's four wickets and Michael Bracewell's pressure did the thing left-arm orthodox spin has been doing to India's middle order for years. That is not a new finding; the new part is that it surfaced inside the very match being sold as a coming-of-age story.
Both teams displayed the same structural weakness in the same match — losing control of the middle phase. The only difference was that New Zealand had Phillips to cover it and India had Tilak Varma. India reached 112/6, the sixth wicket. My reconstruction puts that wicket down to Naman Dhir, whose 31 came off 17 balls at 182.4 with three sixes. The reconstruction is derived from the score arithmetic and reconciles to within a few runs of extras — medium confidence, not fact.
Read Dhir's innings through the scouting lens: three sixes in seventeen balls is a signal. An auction board does not move on 40 off 35; it moves on 31 off 17. That is my long-standing bias and I will not hide it — I treat the auction as a public pricing experiment that can be graded two seasons later, and shot-heavy cameos are what reprice fastest in that market.
Then Tilak Varma: 51 not out off 26, a strike rate of 196.2, with six fours and one six — thirty of his fifty-one runs from boundaries, 58.8 per cent. A healthy boundary share for a modern finisher sits around 55-65 per cent, so the profile is sound: the runs were boundary-built, not milked. Tilak's 196.2 came in an innings where his team was 70/5; he absorbed the Santner pressure phase first and accelerated afterwards. That is the difference between a specialist finisher and a long-term No.3/No.4. Before I rank a player I ask what the ball was doing — and here the ball was turning, the score was 70/5, so the innings is worth more than its runs.
Nitish Kumar Reddy finished 26 not out off 13 at 200.0. That number alone is statistically meaningless; thirteen balls cannot establish technique, temperament or format fit. His whole match says something else: he bowled, took a wicket, then scored at 200. Nitish is the most valuable structural data point of this match — a genuine seam-bowling allrounder frees a slot for India, and that slot is the most expensive real estate in the next two years of team-building.
Which is also his biggest risk. A player doing two jobs every match doubles his workload. Fixture congestion itself is the biggest injury culprit; no medical team can save a player from two games a week. Bhuvneshwar Kumar, in the same attack, is in the last stretch of the age curve at roughly 35 — so India's seam rotation will get faster, and four different seamers used in one match is proof the rotation is already live.
Contrarian angle: a post is not data
Gambhir's 'boys becoming men' is a coaching signal, not a scouting report. The two innings the framing rests on — Dhir's seventeen balls and Nitish's thirteen — total thirty balls. Thirty balls establish no technique, fix no temperament, prove no format suitability. Inside a dressing room the message does its job; young players need belief and I have no argument with that. My argument begins when that sentence is read outside as evidence of a result.
The easy and wrong move here would be to call the win hollow and walk away. I will not. Going 2-0 up in New Zealand is a strong signal in itself and I cannot dismiss the result. But a chase completed with four wickets down and one ball spare is a high-variance outcome, not a controlled performance. That is what makes this a process-negative, result-positive win, and for series forecasting the process signal stays more predictive than the scoreline.
The sample limit applies to my own inversion too, and I will write it down before someone else does: my counter-argument comes from one match of 120 balls. The claim that India lack middle-overs spin control is a hypothesis, not a finding. And New Zealand were playing at home on a surface their own players read no better than India's did — using home conditions as an argument against them would be dishonest.
Takeaway: the two numbers match three will settle
I am pre-registering three results, because a conclusion with no stated falsifier is decoration.
First, India's spin control between overs seven and sixteen. If they field a specialist spinner next match and he goes at under 7.5 in the middle overs, my spin-gap argument weakens and I will say so. Second, Bevon Jacobs' strike rate: if he strings together innings above 130, my complaint about his value is worthless. Third, and most important, New Zealand's top order. If it collapses to 41/3 again, that is not a one-match issue but a structural batting problem — and India's win is smaller than it looks.
My job is to make the model legible to people who must act, and the verdict here is simple: the 2-0 is banked, the process is not. Whether the 111 runs after 70/5 in Christchurch were an innings or a beginning gets answered in the sixteenth over of the next match, when India's middle order faces left-arm spin again and we find out whether that was last time's mistake or this time's habit.